Faked Up academic library

This is a regularly updated collection of academic studies cited in Faked Up or that have otherwise caught my eye. It currently includes short descriptions of 49 academic studies and systematic reports organized in five clusters:
- Prevalence and characteristics of misinformation
- Effects of fact-checking interventions
- Prevalence, effects, formats, and labeling of AI-generated deceptive content
- Synthetic non consensual intimate imagery
- Other
Email me studies you think I should add at mantzarlis@protonmail.com!
PREVALENCE AND CHARACTERISTICS OF MISINFORMATION
Analyzing the temporal dynamics of linguistic features contained in misinformation
📇 arXiv | Mar 2025 | Erik J. Schlicht
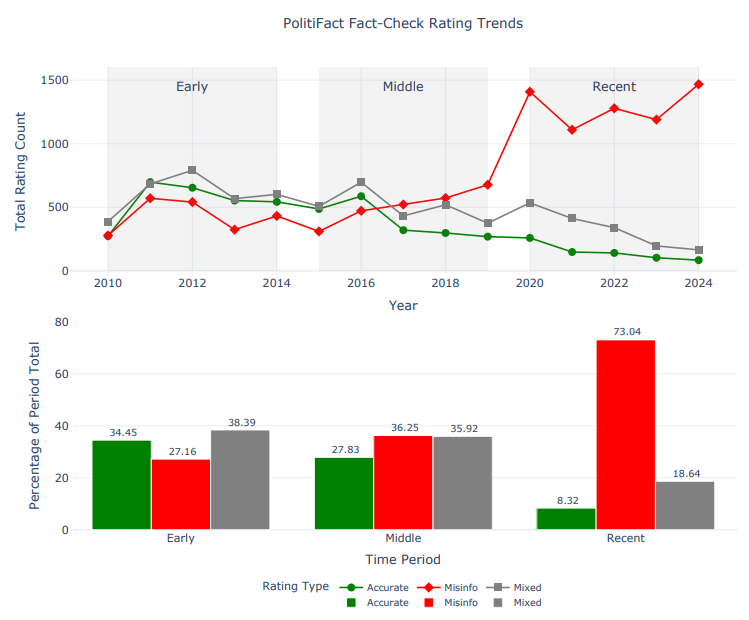
This analysis of PolitiFact's fact checks over time posted on arXiv caught my eye. The author collected the ratings assigned by the Pulitzer prize-winning fact-checker and found that there was a significant increase in the rate of false ratings assigned starting in 2020. (Like other fact-checkers, PolitiFact also assigns "True" ratings when they are warranted). The rise in misinformation labels appears to have started in 2016-2017, perhaps informed by PolitiFact's partnership with Meta that financially incentivized targeting fake claims over true ones. But the real surge coincided with the COVID-19 pandemic.
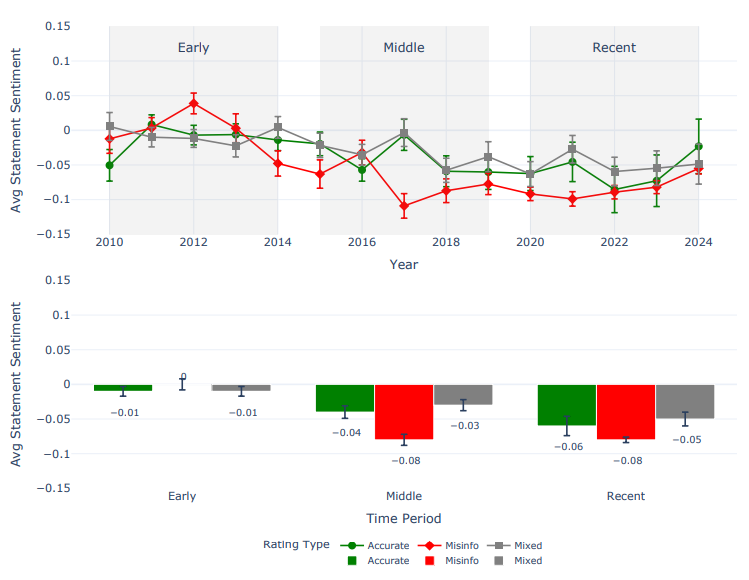
The analysis also found that the average sentiment of the claims that PolitiFact covers has become markedly more emotional and more negative since 2016.
The Diffusion and Reach of (Mis)Information on Facebook During the U.S. 2020 Election
📇 Sociological Science | Dec 2024 | Sandra González-Bailón, David Lazer, Pablo Barberá, et al.
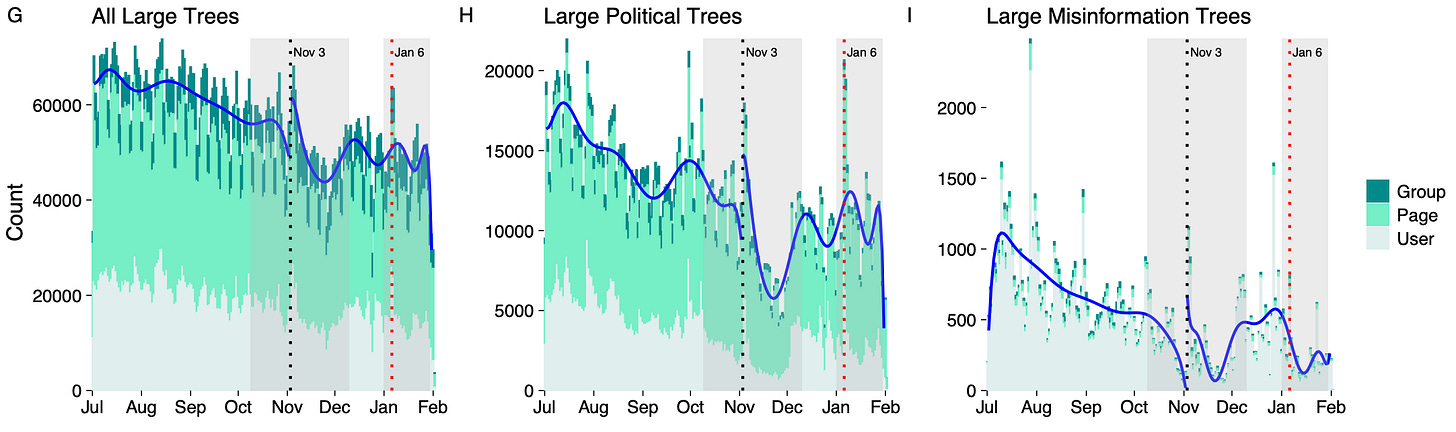
Made possible by access to Meta data negotiated by Talia Stroud and Josh Tucker, this study tries to characterize the spread of misinformation flagged by fact-checkers on Facebook and Instagram during the 2020 US elections. It concludes that while information as a whole primarily spread in a broadcast manner through Pages, misinformation flipped the script and “and relie[d] much more on viral spread, powered by a tiny minority of users who tend to be older and more conservative.”
The study also found a steep decrease in “misinformation trees” on election day (see chart on the right below). Counts then climb back up shortly after the election and until January 6. The researchers suggest but cannot definitively conclude that the dip is due to Meta’s “break glass” measures introduced to reduce viral reach of content on its platforms.